
Estimation of Fourier Coefficients of a Periodic Signal 
Procedure
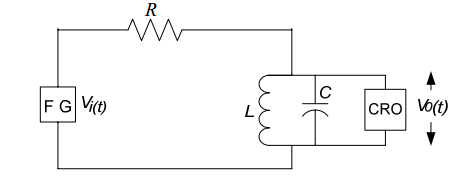
- Connect the circuit elements as mentioned below
1-3 ,3-4 ,5-6, 8-7, 7-9, 10-2(ex:-Drag from 1 and click on 3. Connections are shown in simulator tab) - 3 volt p-p sinusoidal voltage is applied at the input.Put R=100KΩ ,L=10mH, C=100nF.
- Switch on the oscilloscope by clicking "ON" button & click twice the Sine wave button for input signal & click on the"Output" button to observe the output.Channel & Channel2 button shows the input & output signals respectively. Dual, shows both of them.
- Change the Frequency of input signal by the Frequency knob from 100Hz to 100KHz & observe the corresponding output voltage signal.
- Click on Tableshow button each time after clicking on "output" button to see observation eachtime.
- Click on Plot button to see the frequency response plot(Gain(dB)vs.Frequency(Hz)).Click on Clear button to clear datas.
- Switch off the oscilloscope.Then again switch on.
- click on 'square wave' button & keep the frequency around 15KHz.click 'square output' to see first harmonic component & click on 'Tableshow' to have the fundamental Fourier series coefficient value
- Repeat the above step for square wave input of frequencies around 5KHz & 3.5KHz to have values of 3rd & 5th harmonic Fourier series co-efficients respectively.
- Switch off the oscilloscope.
- For above three steps keep L & C values 10 mH-10nF, 1mh-100nF, 0.1mH-1000nF each time before changing the frequencies.Each time readings should be taken for three sets of values of L and C.